MulticsPlotter
This section of the documentation highlights the use of MulticsPlotter, a tool which allows a user to examine the results of one or multiple Multics simulations. Reach out to the Maha team for more information on this tool.
The layout of the MulticsPlotter GUI can be seen below.
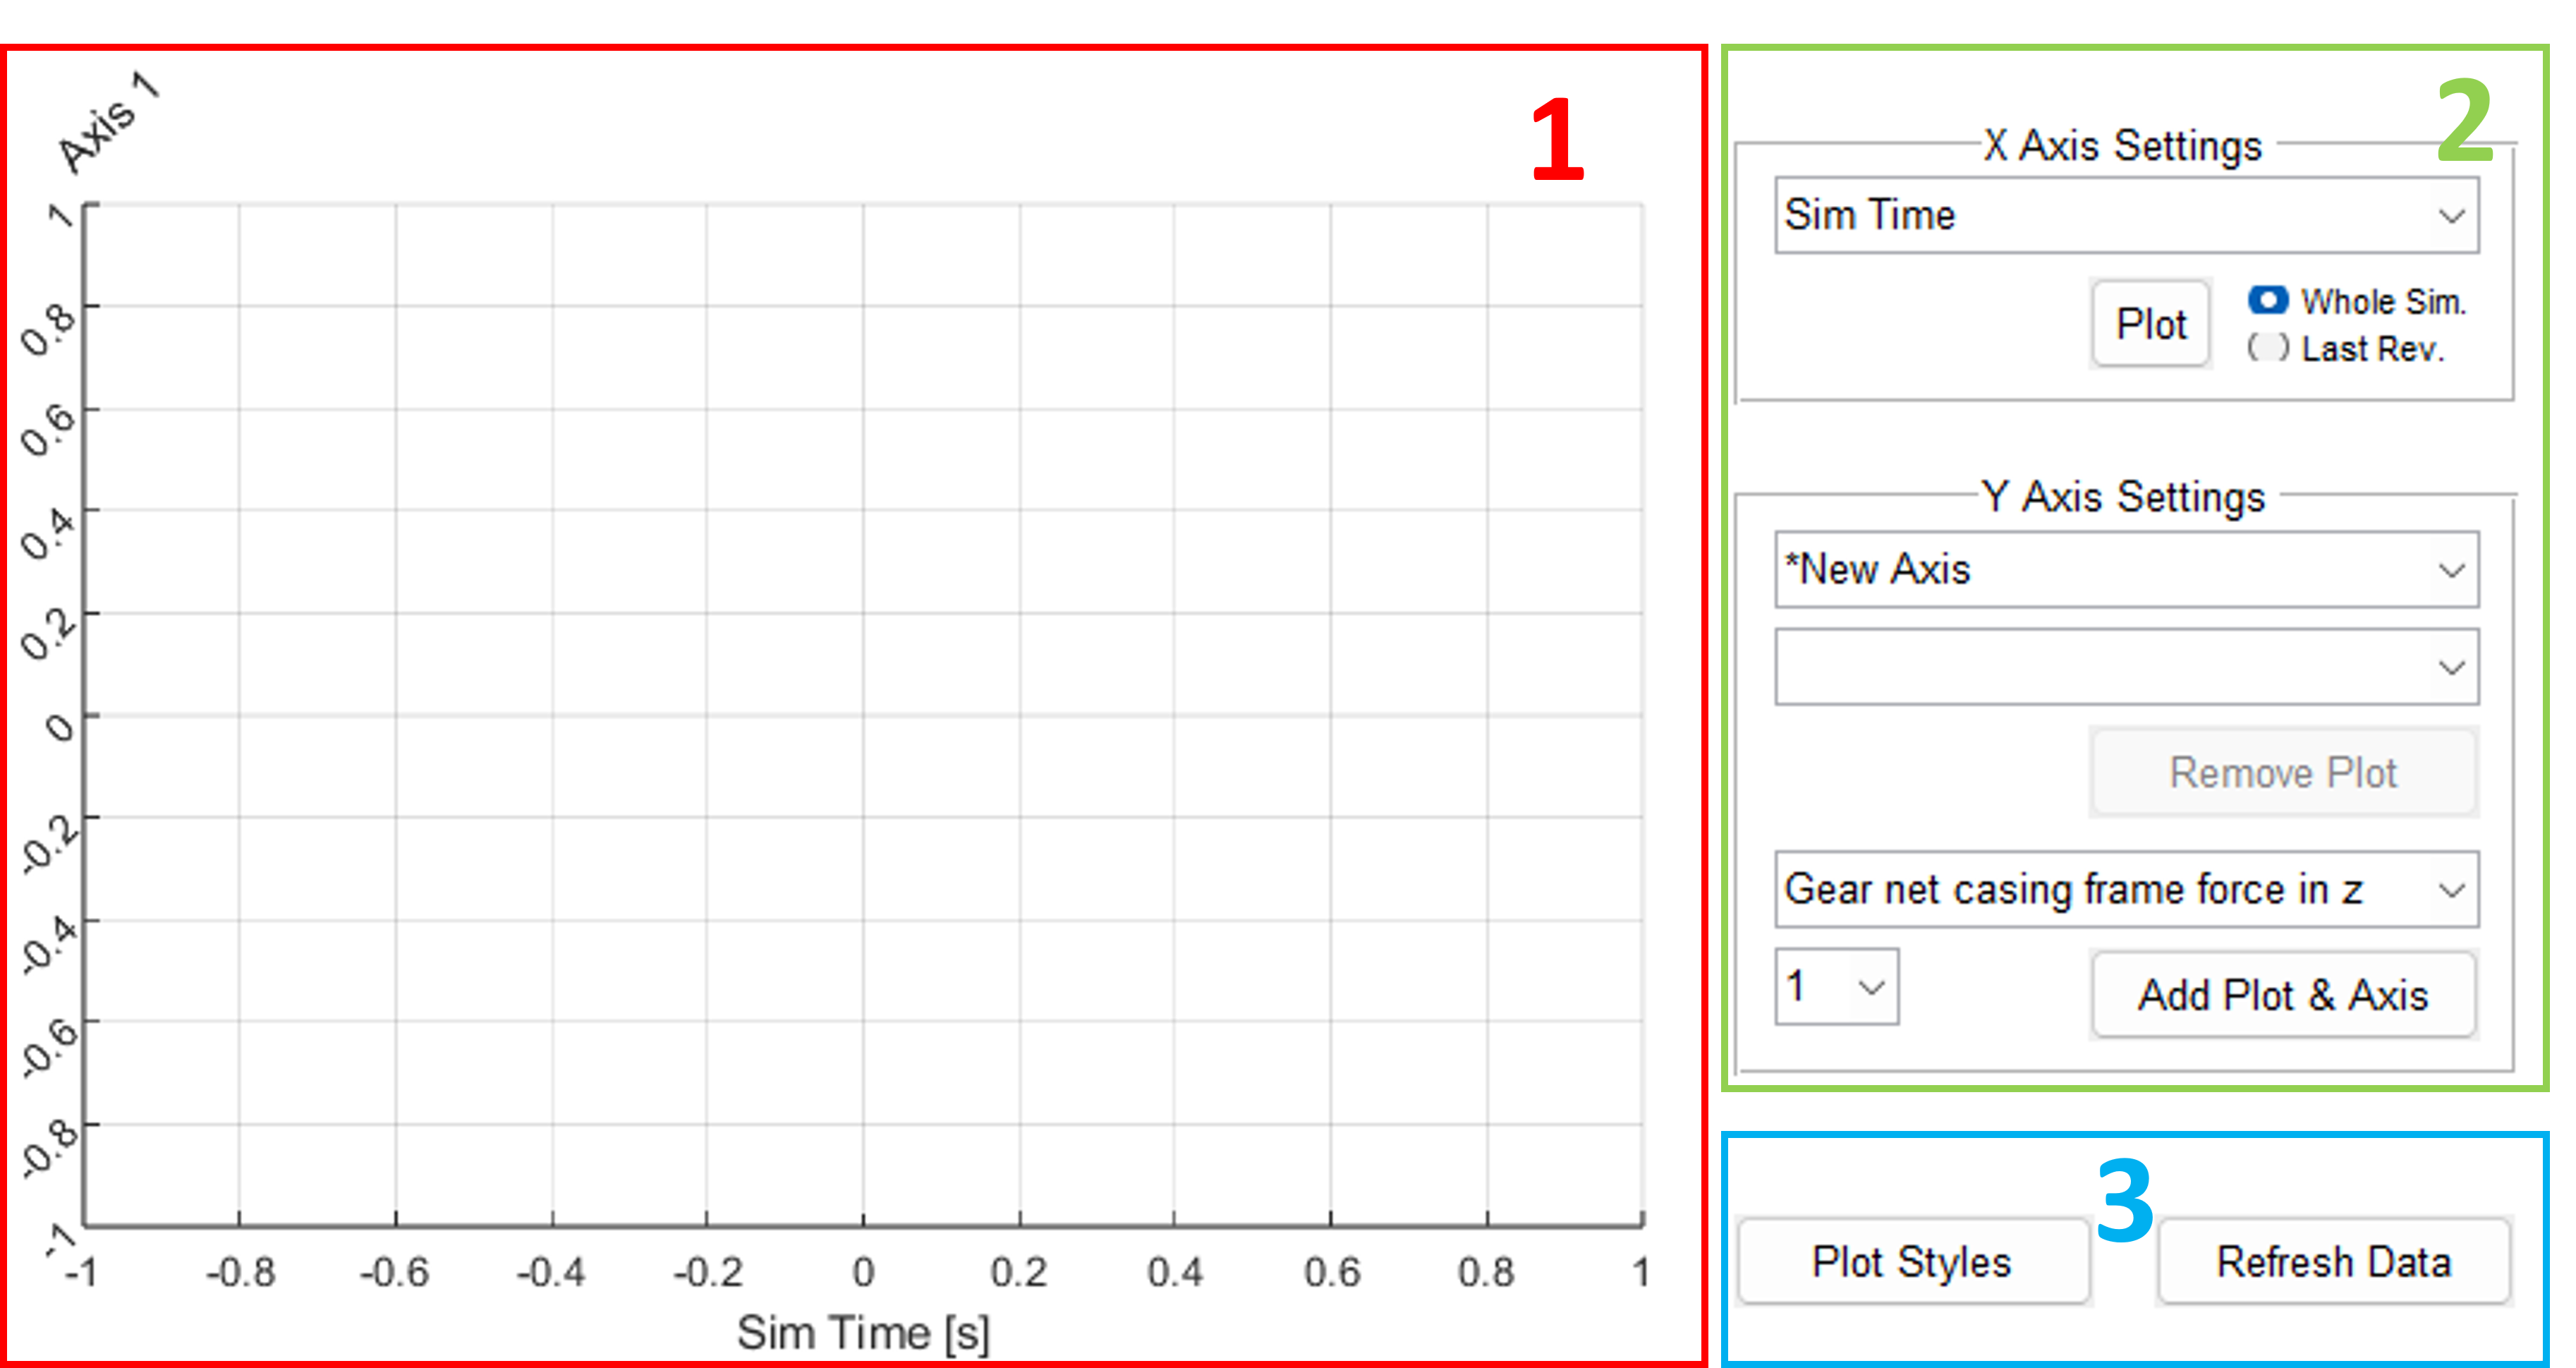
MulticsPlotter GUI
1 Plotting Window
This window is where the plotted results will appear. In the case of multiple y-axes, all plotted data will still appear on this screen.
2 Axis Settings
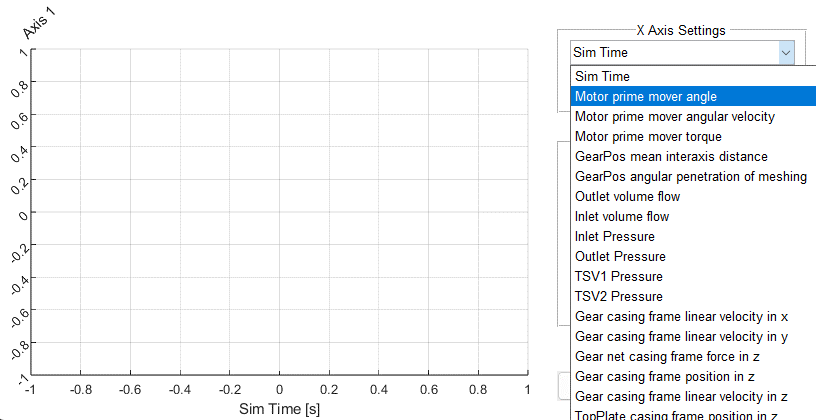
These menus control which data is plotted and with respect to what. The top pane is the x-axis settings, and will generally default by plotting data with respect to the simulation time. In some cases, though, this may not be ideal and we can instead select a different quantity such as “motor prime mover angle”, or shaft angle.
The bottom-most pane of this panel is the y-axis settings, which control the data plotted on the plotting window. Users can click the bottom dropdown menu and select the data they would like to plot, as seen below.
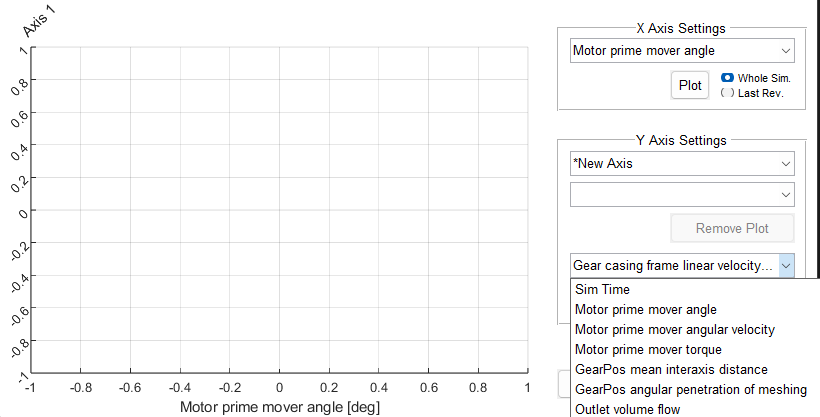
When this data is selected, the Add Plot & Axis button must be pressed, at which point the plotting window will be updated with this data.
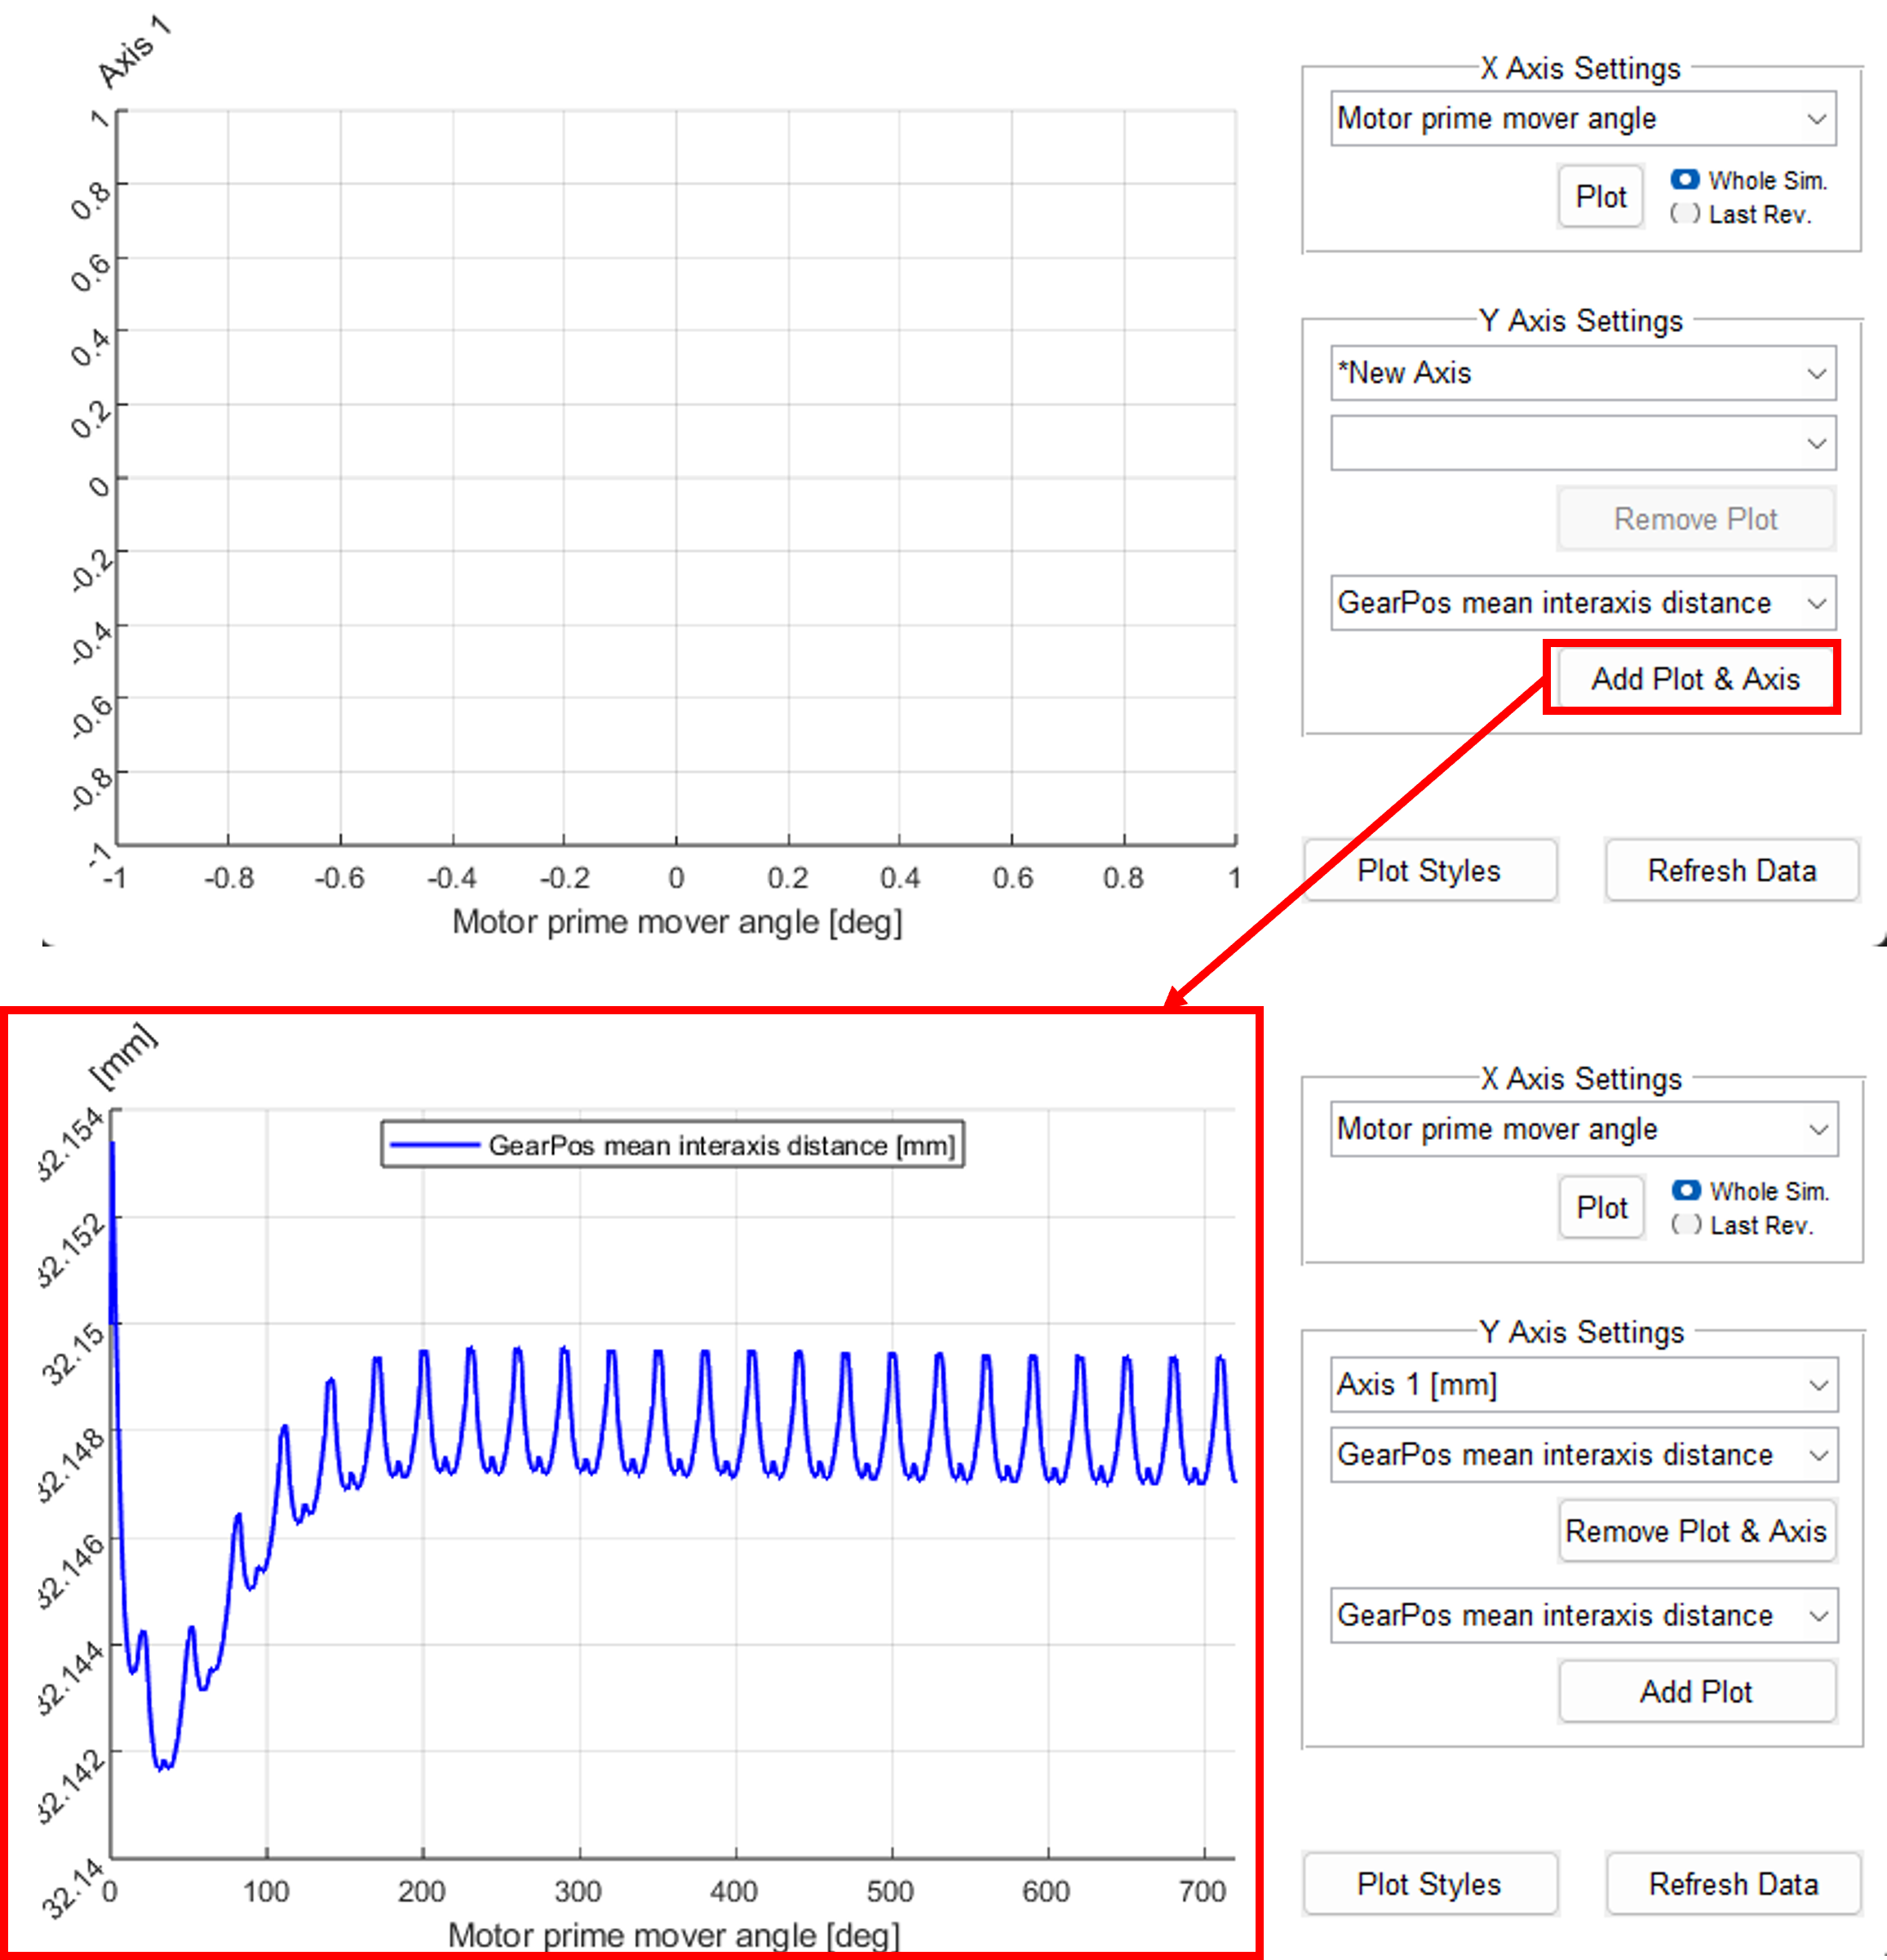
At this point, if the dropdown menu is clicked again, only data with the same units as those plotted on the currently selected axis will be available to choose from. If the user wants to plot data with different units, they must select the top dropdown menu in the y-axis settings box and choose a currently existing axis with those units, or select *New Axis and choose their desired data from the previous dropdown menu.
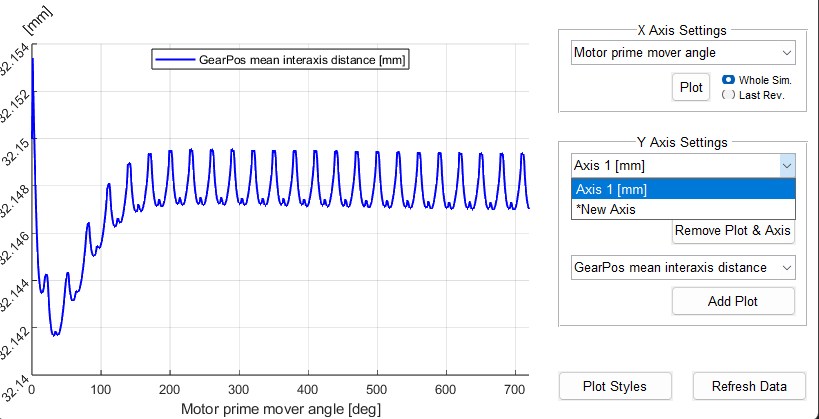
Immediately beneath the axis dropdown menu is another dropdown menu from which the user can select the currently plotted data on that axis. Using this menu, the user can remove specific lines from the plotting window from each axis.
3 Plot Settings
Within the plot settings there are two buttons: Refresh Data and Plot Styles. The Refresh Data button, when pressed, re-reads the data file initially selected by the user. It is primarily used when the user is plotting results from a simulation which is still running. The PlotStyles button, when pressed, opens a new window from which the user can manipulate the plot to their choosing.
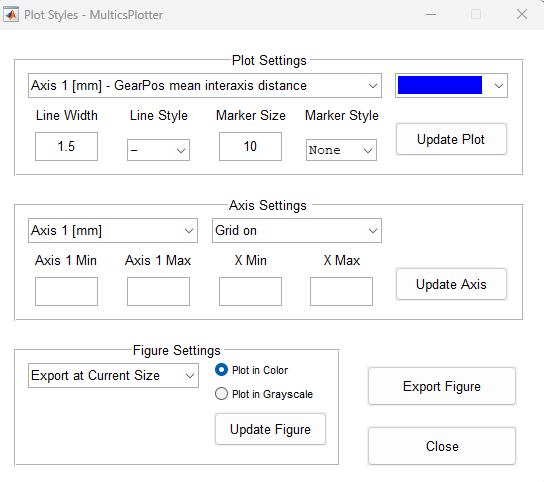
In this window, there are three settings. In the plot settings, the user can change the color, line width or style, and marker width or style of each individual line. The Update Plot button must be pressed for any changes selected to update in the plotting window. In the axis settings, the user can enable an axis minimum and maximum and toggle the grid on or off. The Update Axis button must be pressed for any changes to update in the plotting window. In the figure settings, users can select the settings to export the figure.
MulticsPlotter Scripting
The MulticsPlotter function can also be used within a MATLAB script to create plots outside of the GUI if the user prefers it. The user can call the function using the line seen below.
simData = MulticsPlotter(JustRead = true, ResultName = "pathTo_simulation_results");
Here, the input JustRead is set to true so that an instance of the GUI is not opened, and the input ResultName is set to the path, relative or absolute, of the ‘simulation_results.txt’ file. If the ResulName input is not given, a window will open which allows the user to search their PC for the simulation results file(s).
Once this data file is selected and read, the user can query this new simulation data object using two important functions. The first is read(), seen below.
shaftAngle = simData.read('Motor prime mover angle');
This line reads the shaft angle data from the simulation into a vector called shaftAngle. It is worth noting that the string given as an input to the read() function must exactly match that of a string recorded internally in the simulation results file.
The user can find these strings by utilizing the second significant function, searchStr(). For example, say that a user wants to plot the pressure force exerted by a lubricating interface. To find this, they may run the following code in the terminal:
simData.searchStr("force")
When run, this line will output all data entries in the simulation results file which contain the keyword force. Note that the searchStr() function is not case sensitive. When the user has found their key of interest, they may copy it and paste it into a read() command, from which they may plot and format the data as they please.
Selecting Multiple Result Files
In some cases, the user may prefer to select multiple simulation result files to compare their data.